01

Public economic data

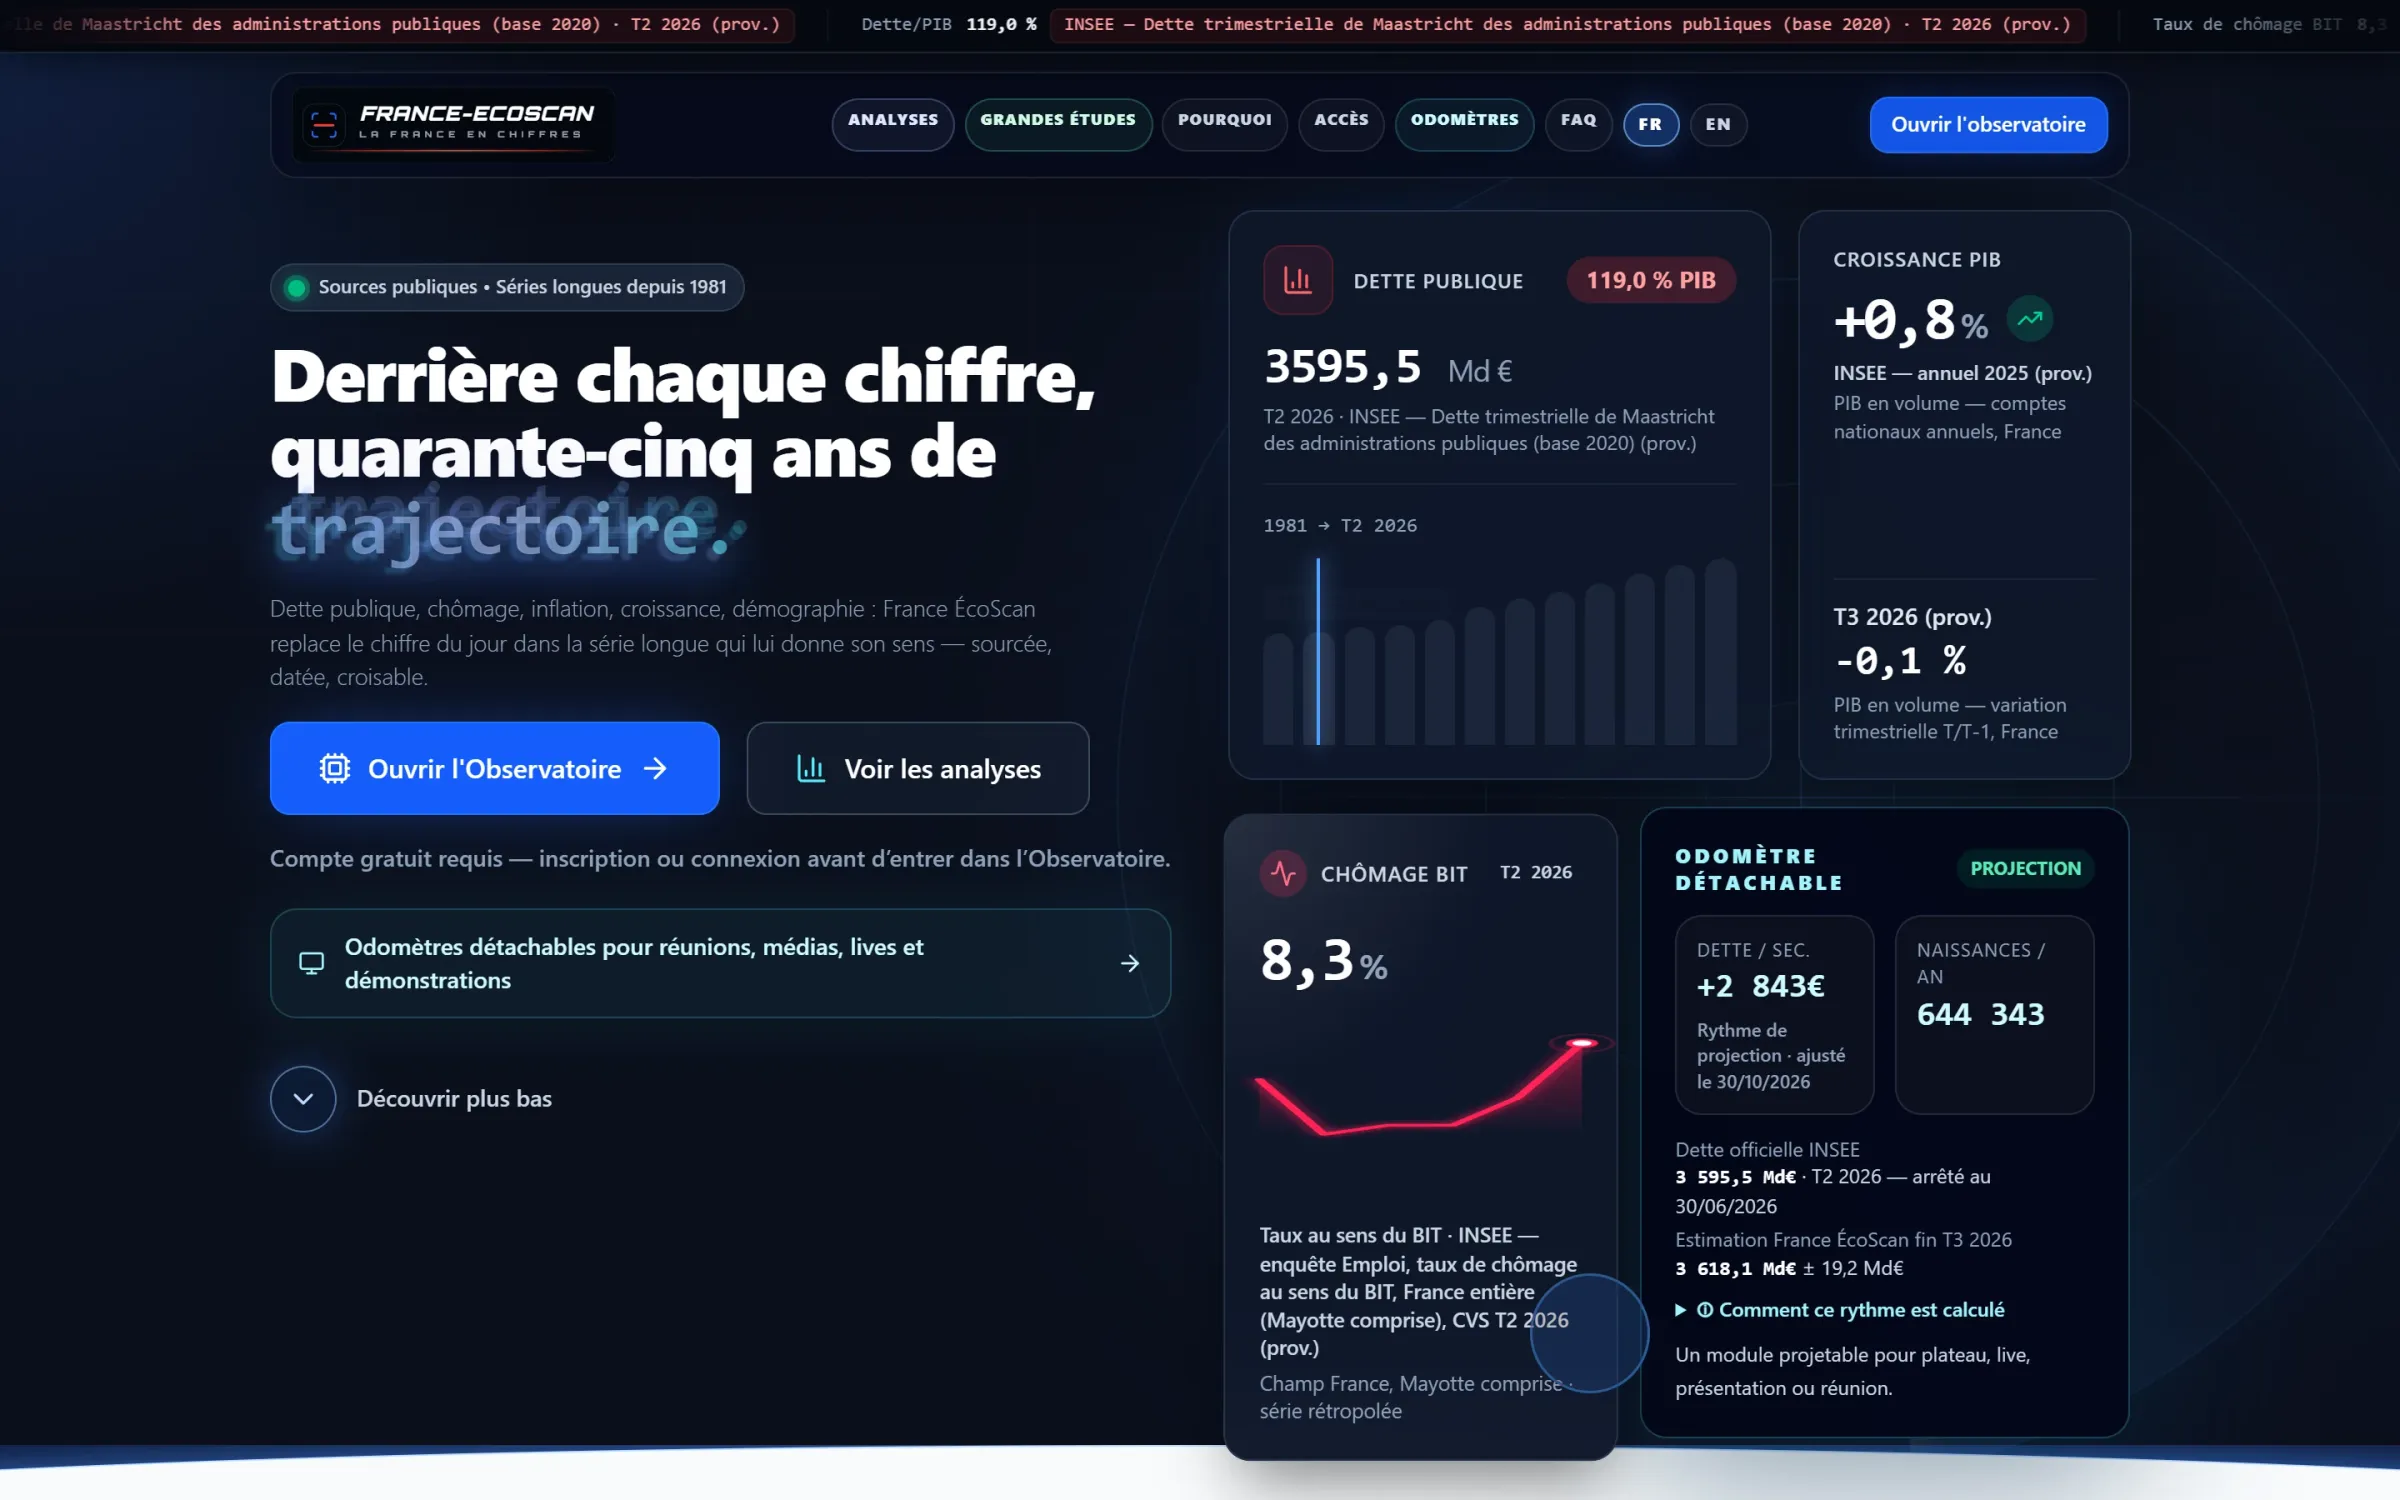
France ÉcoScan: Forty-five years of the French economy to explore, presidential term by term: every figure in its context, with its source.

  • Economic data
  • Public indicators
  • Readability
  • Rigorous reporting

Explore France ÉcoScan (external site) Discuss my project

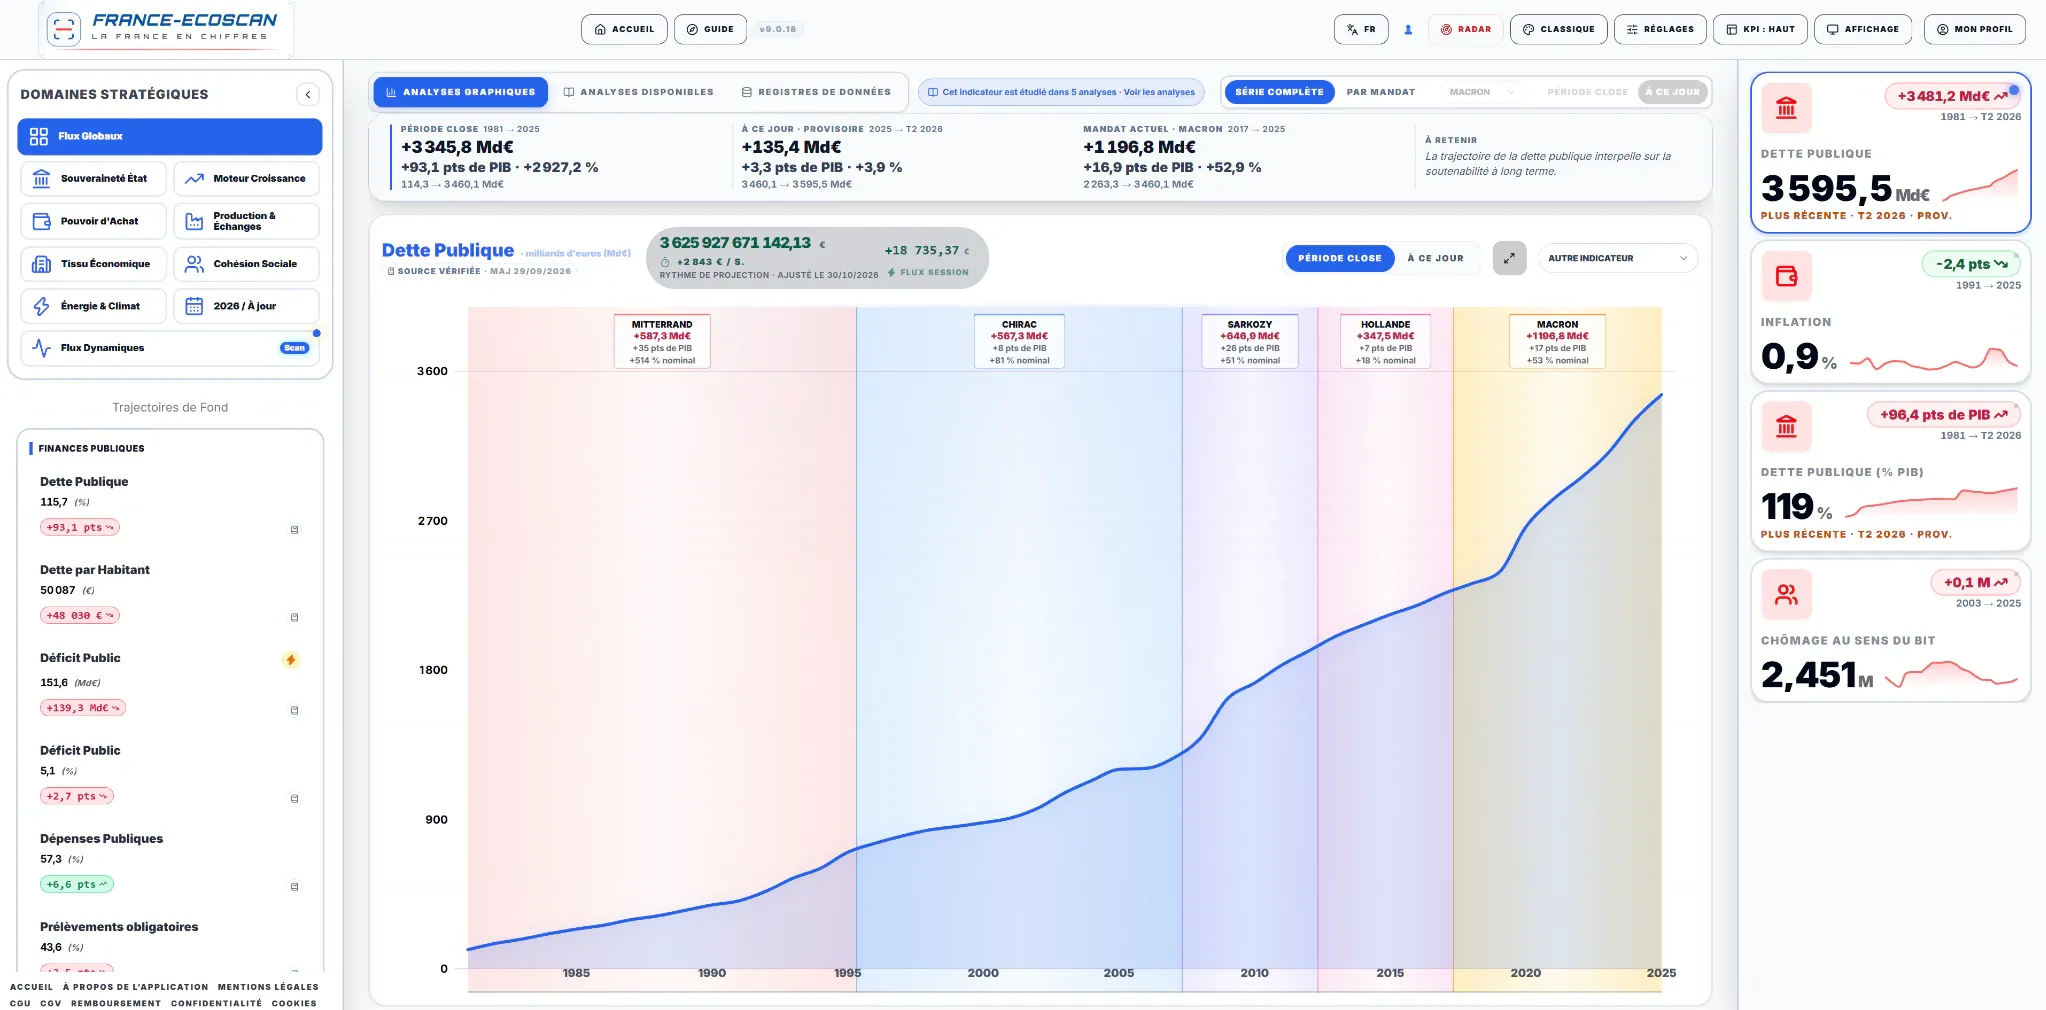
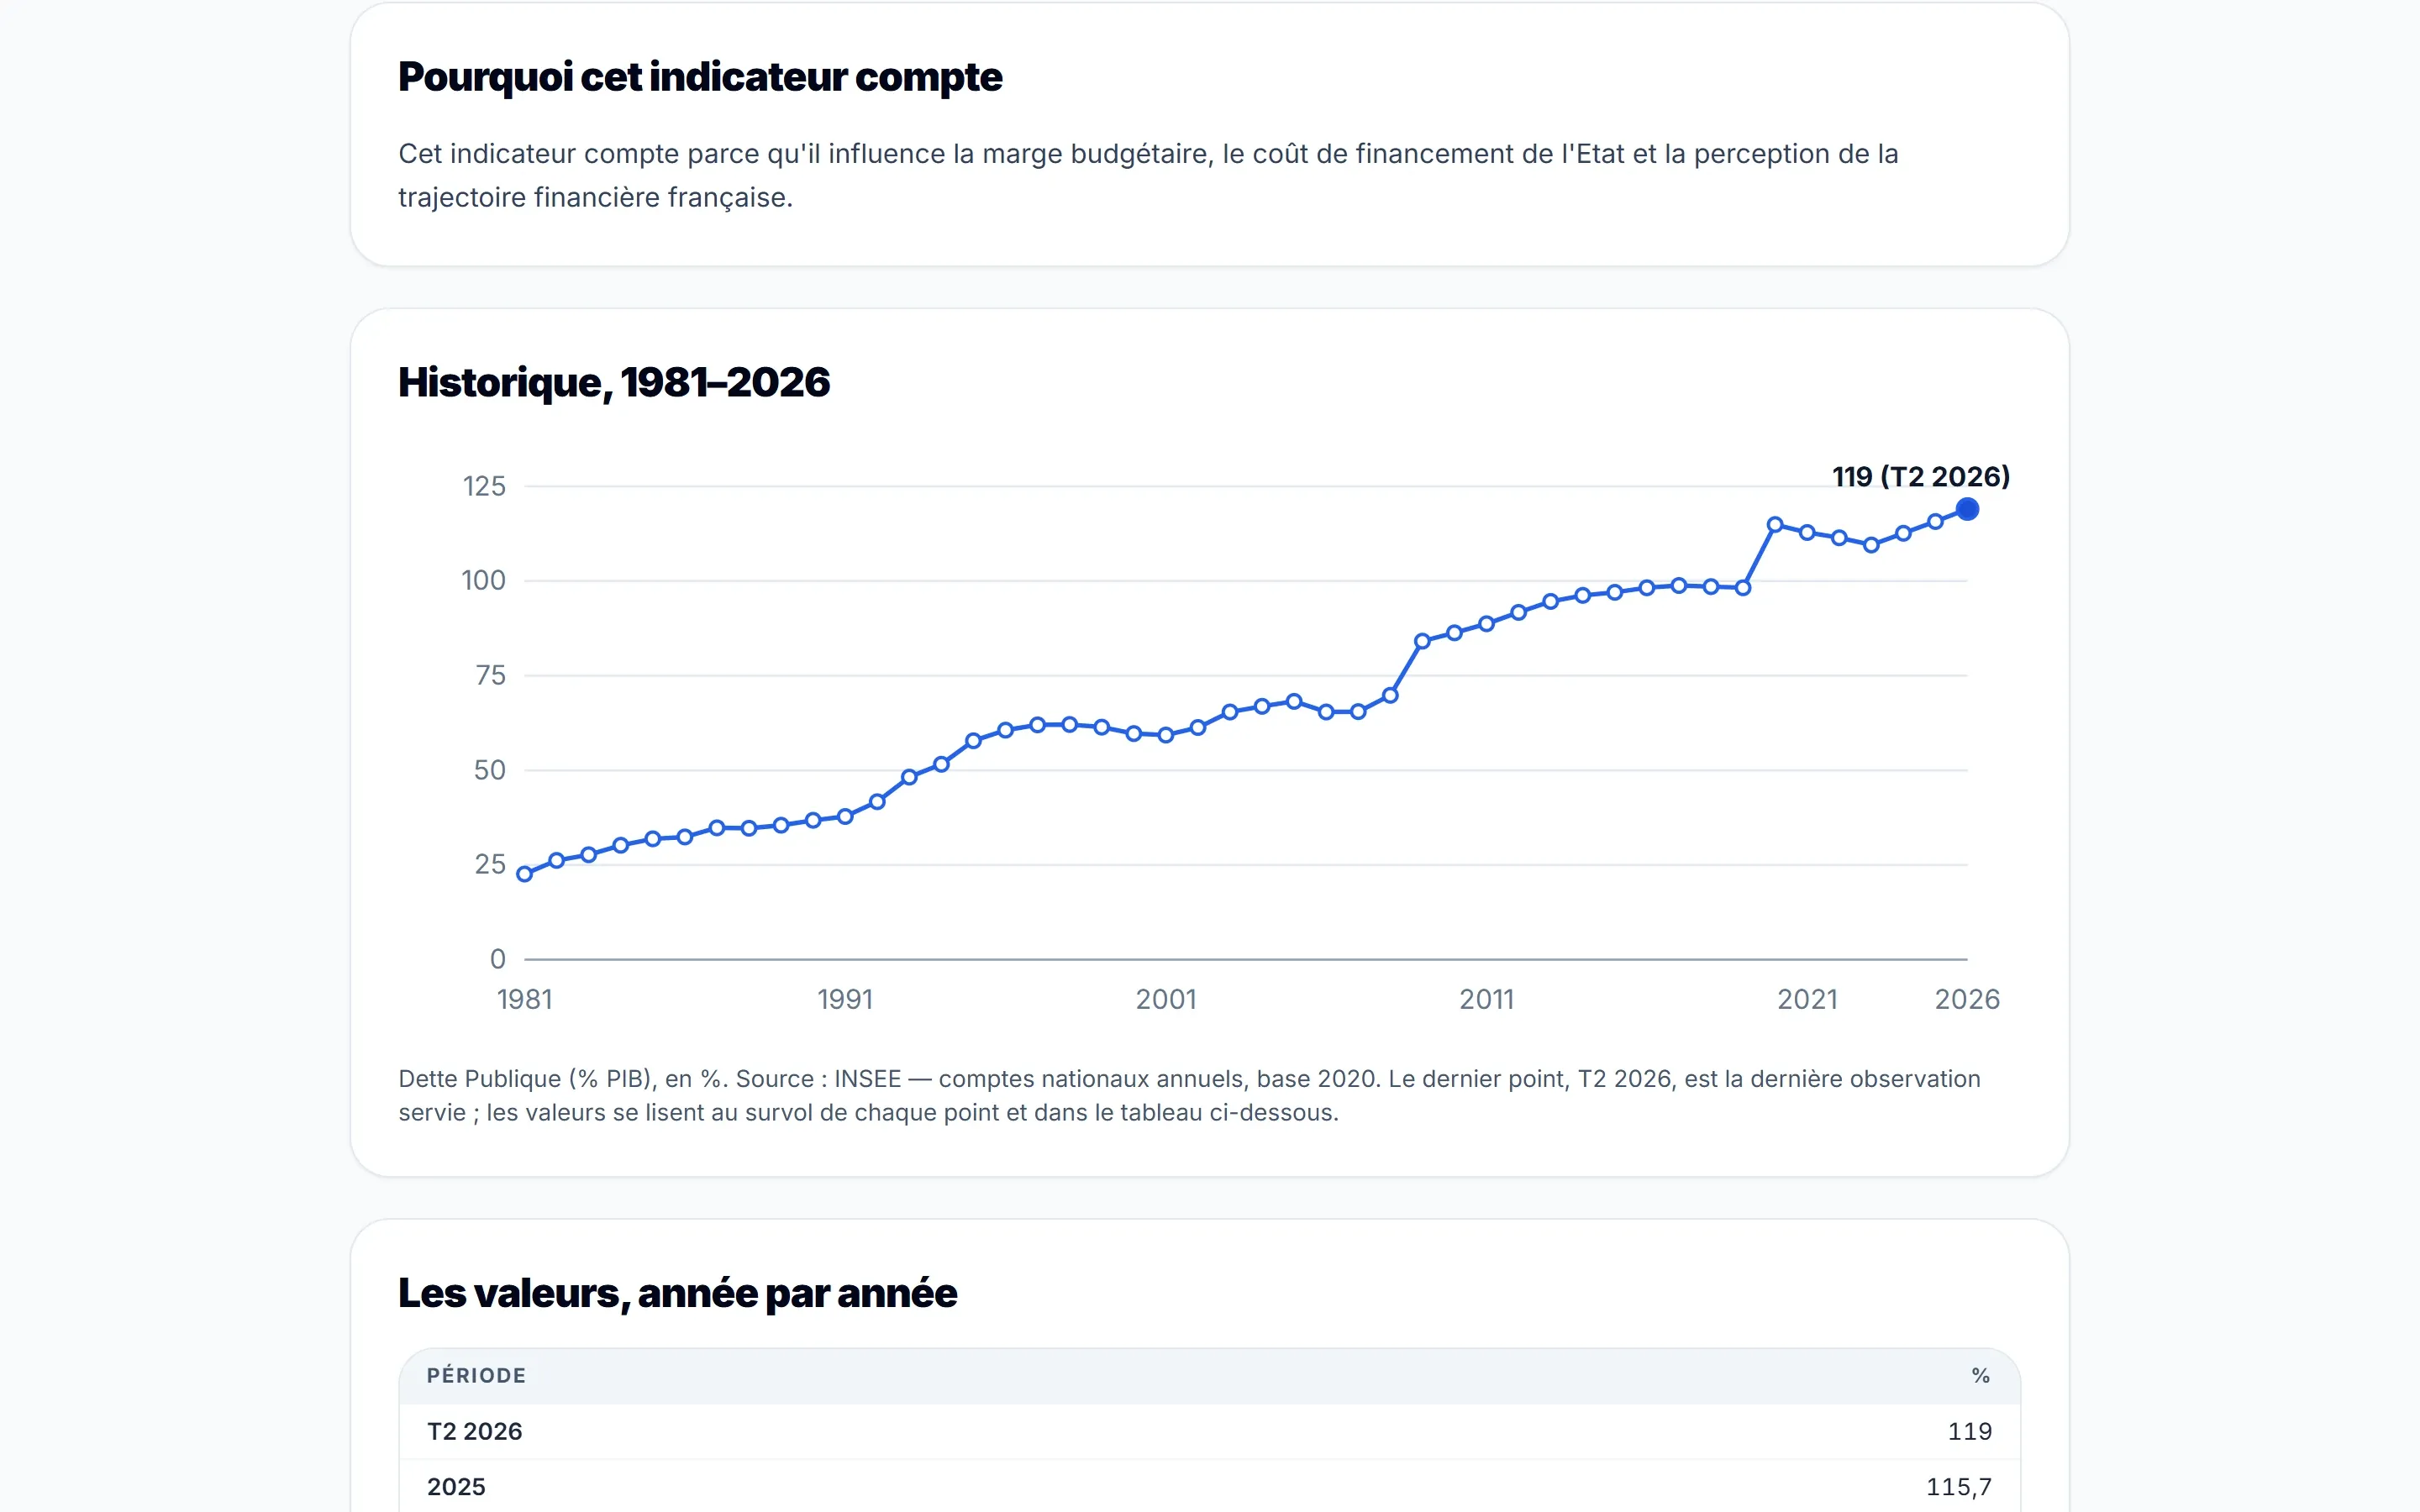
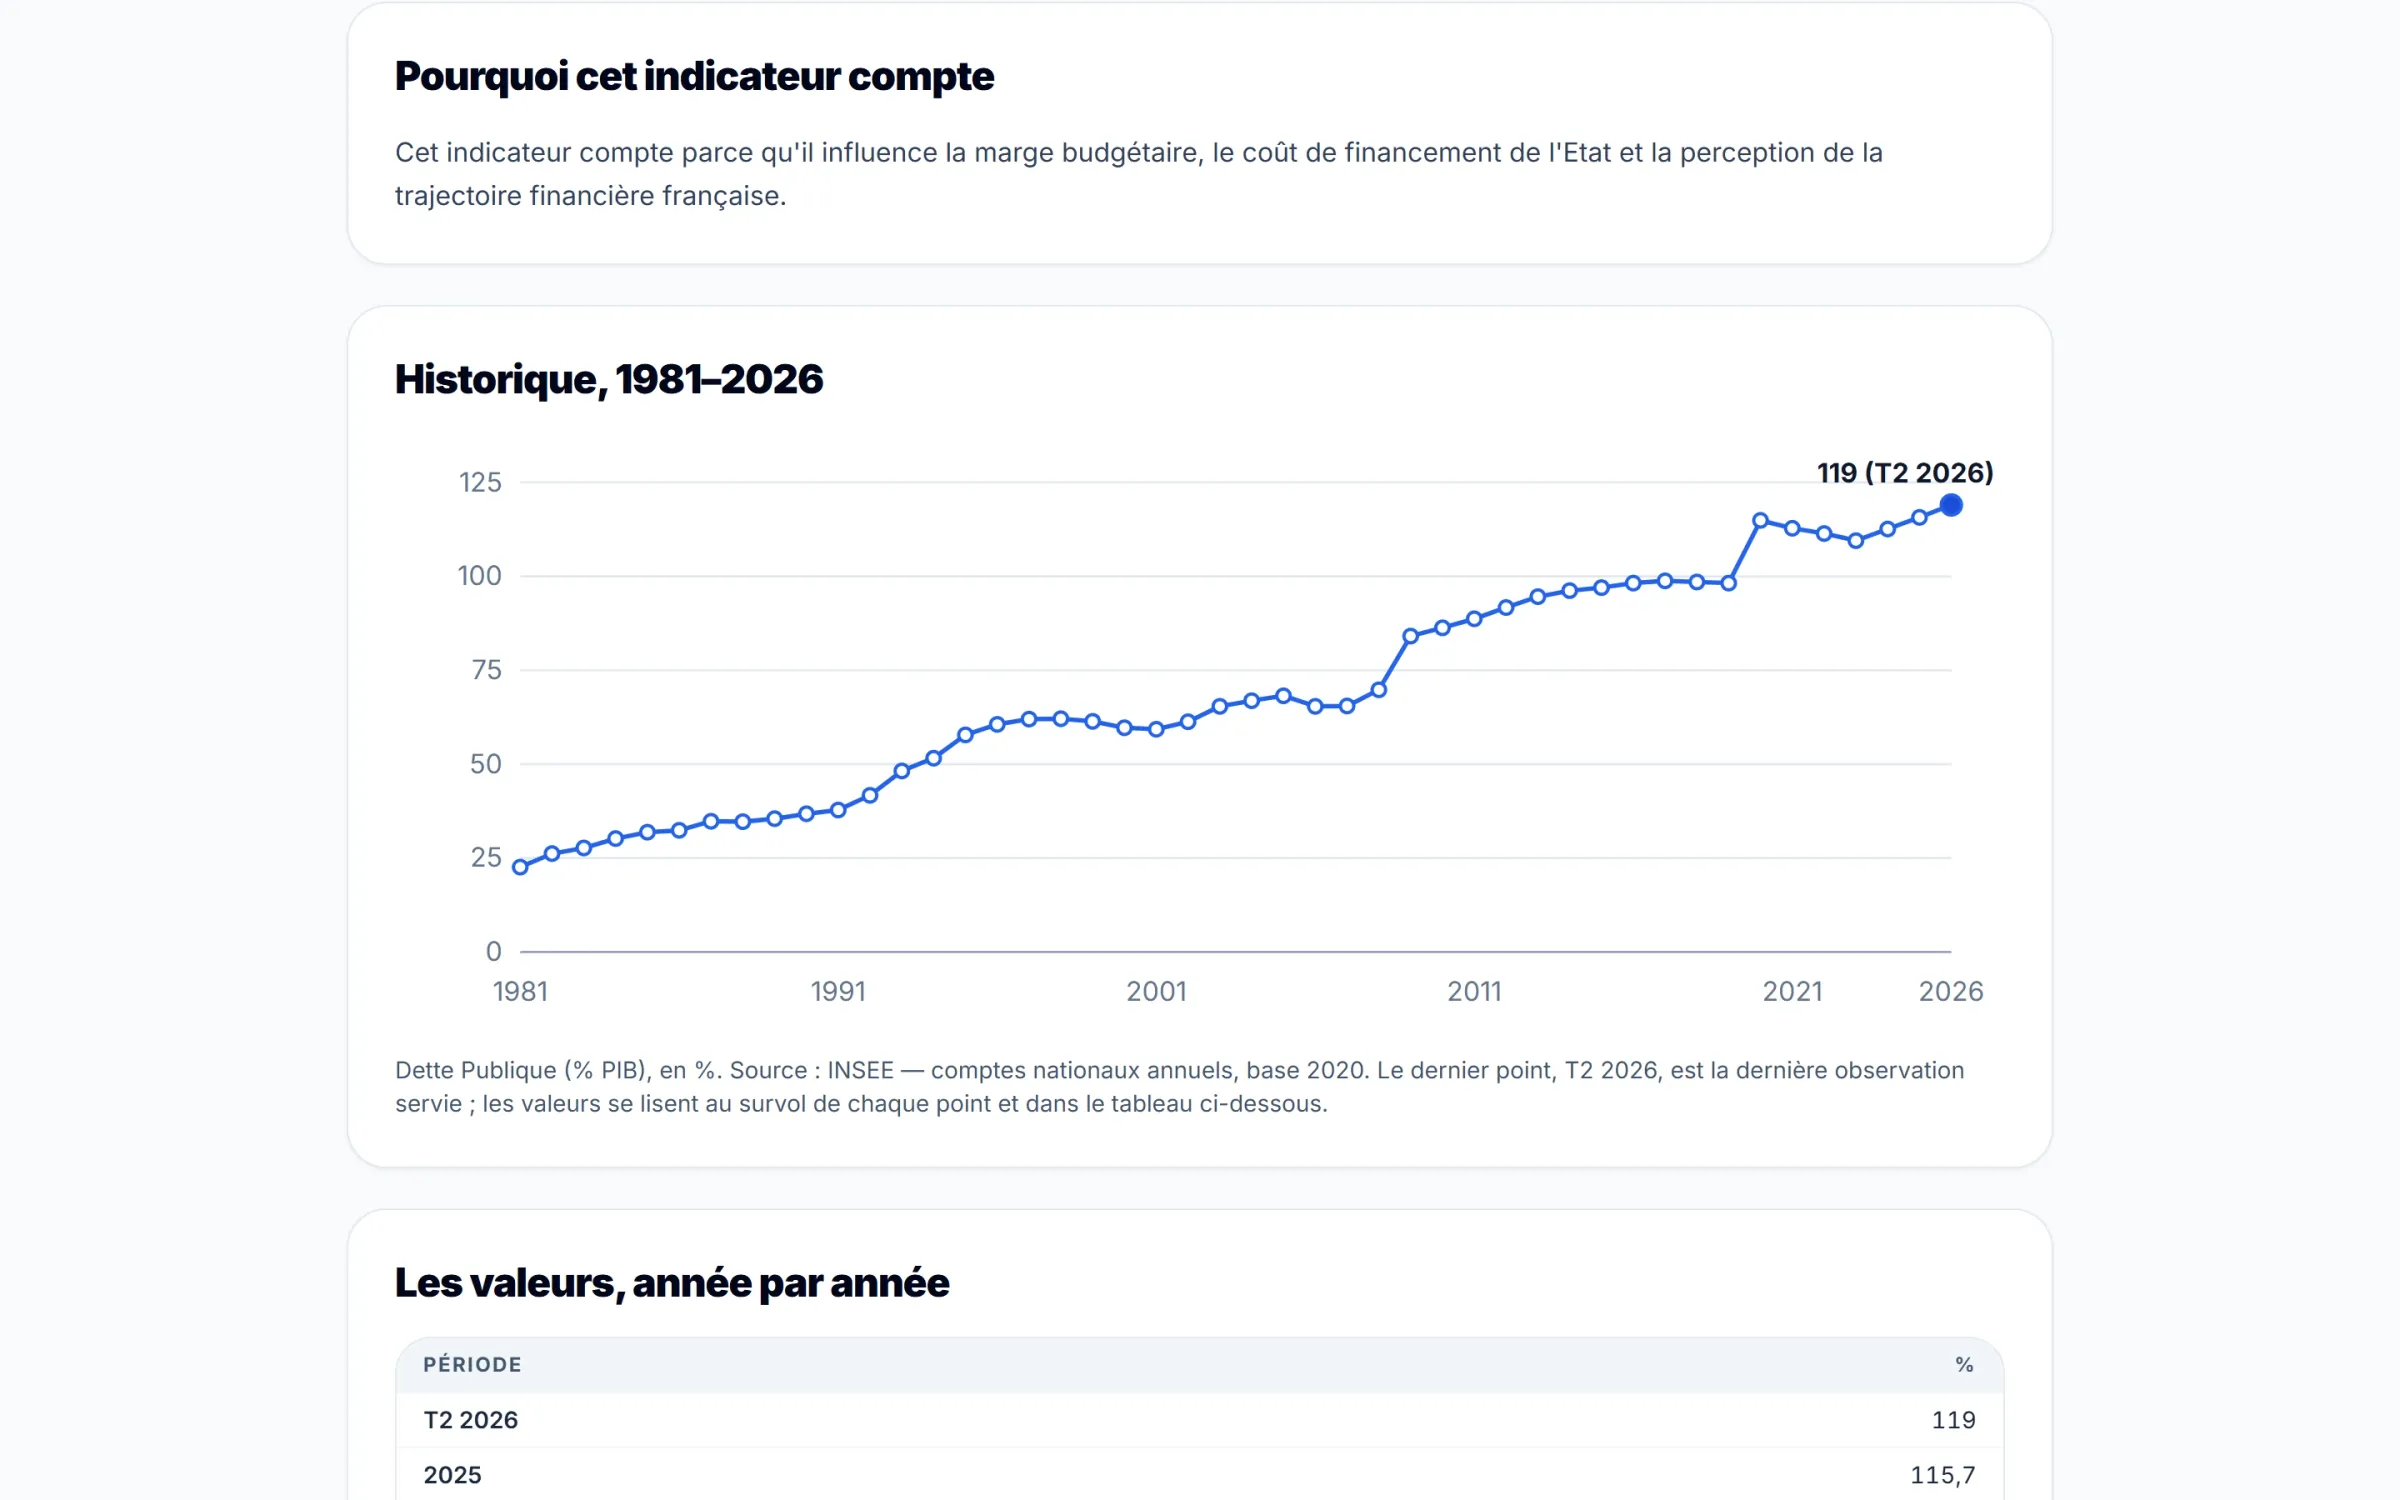
French public debt (% of GDP), 1981–2025. Bands: presidential terms, from Mitterrand to Macron, as chronological markers. Source: INSEE, via the France ÉcoScan public export (accessed 31 October 2026).
View shown
France ÉcoScan Observatory, Classic theme (French interface): the public debt curve from 1981 to 2025 runs through five bands of presidential terms, from Mitterrand to Macron, each with its change; on the left, the domains and public finance indicators; on the right, the latest dated values.
The Observatory (French interface): public debt from 1981 to 2025, read term by term with INSEE series — available with a free account.
View full size — France ÉcoScan Observatory, Classic theme (French interface): the public debt curve from 1981 to 2025 runs through five bands of presidential terms, from Mitterrand to Macron, each with its change; on the left, the domains and public finance indicators; on the right, the latest dated values.
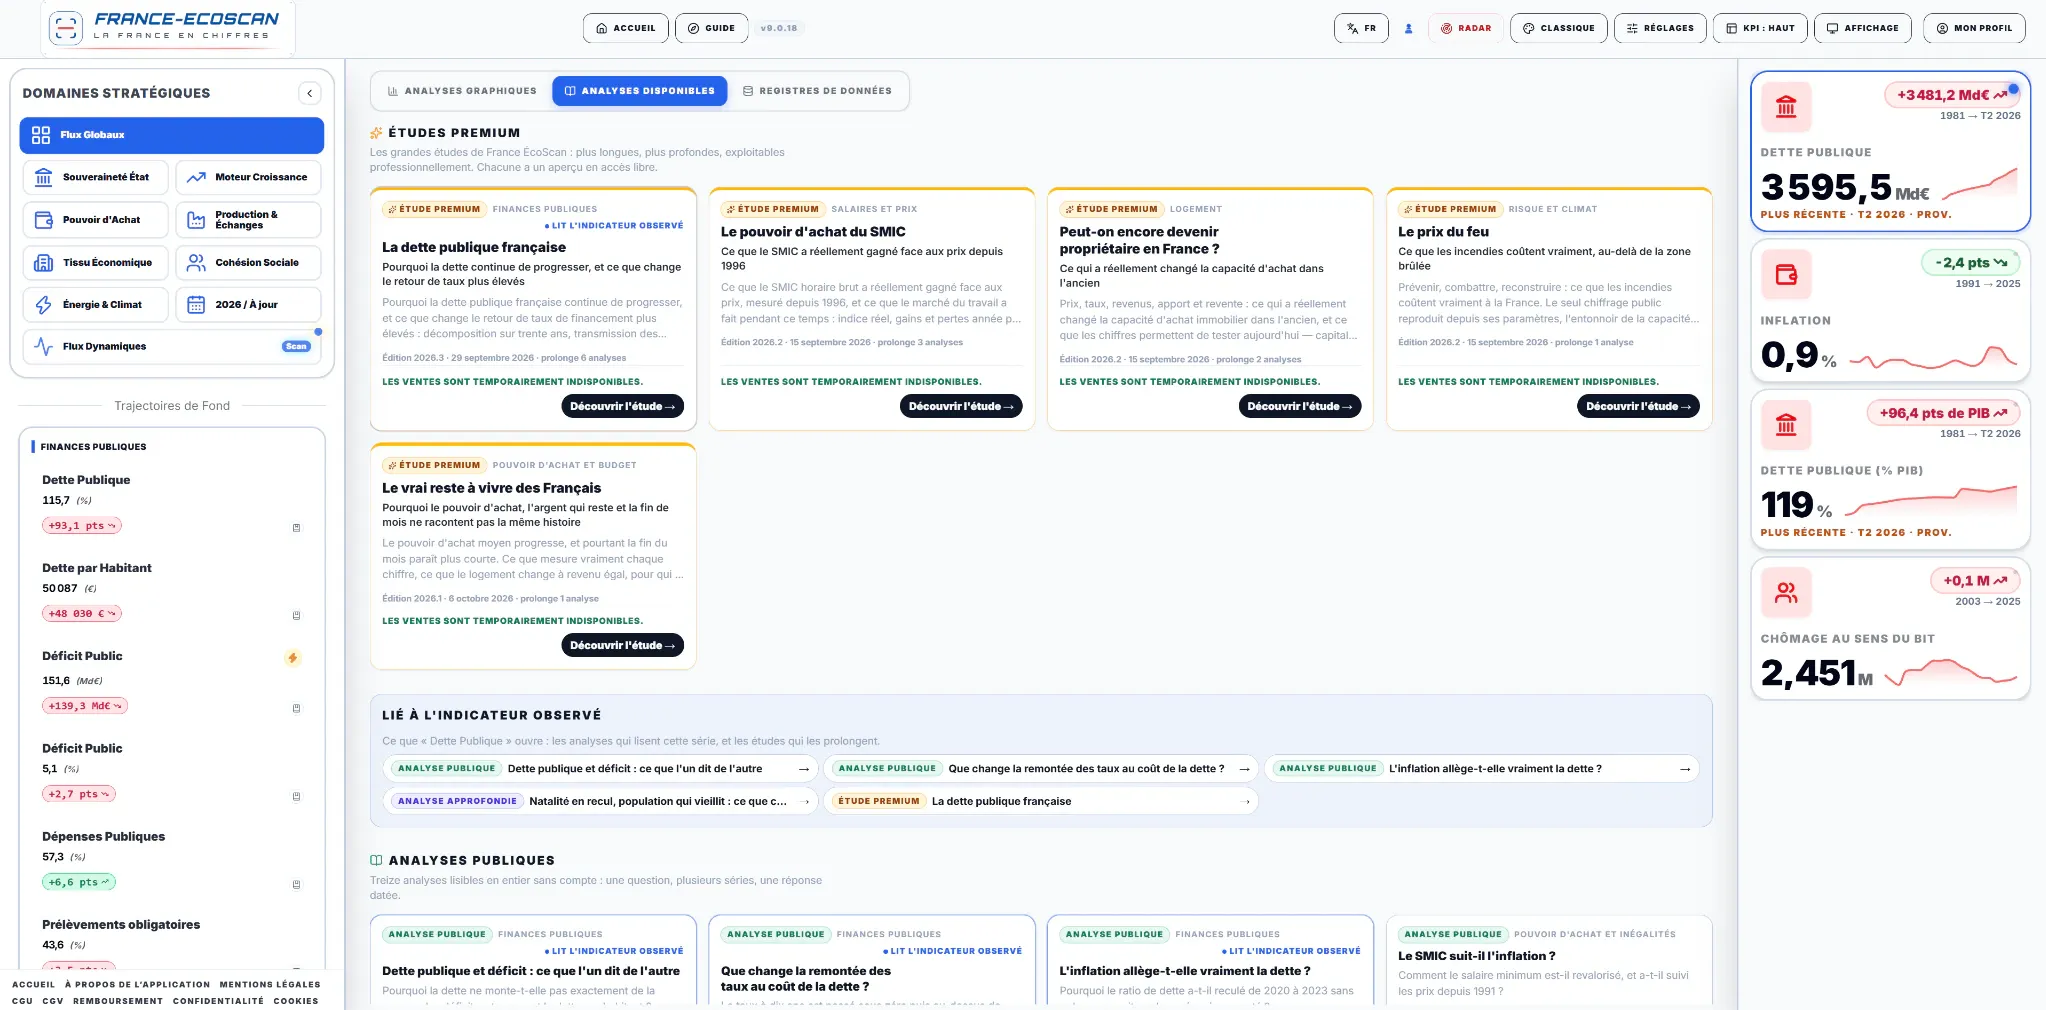
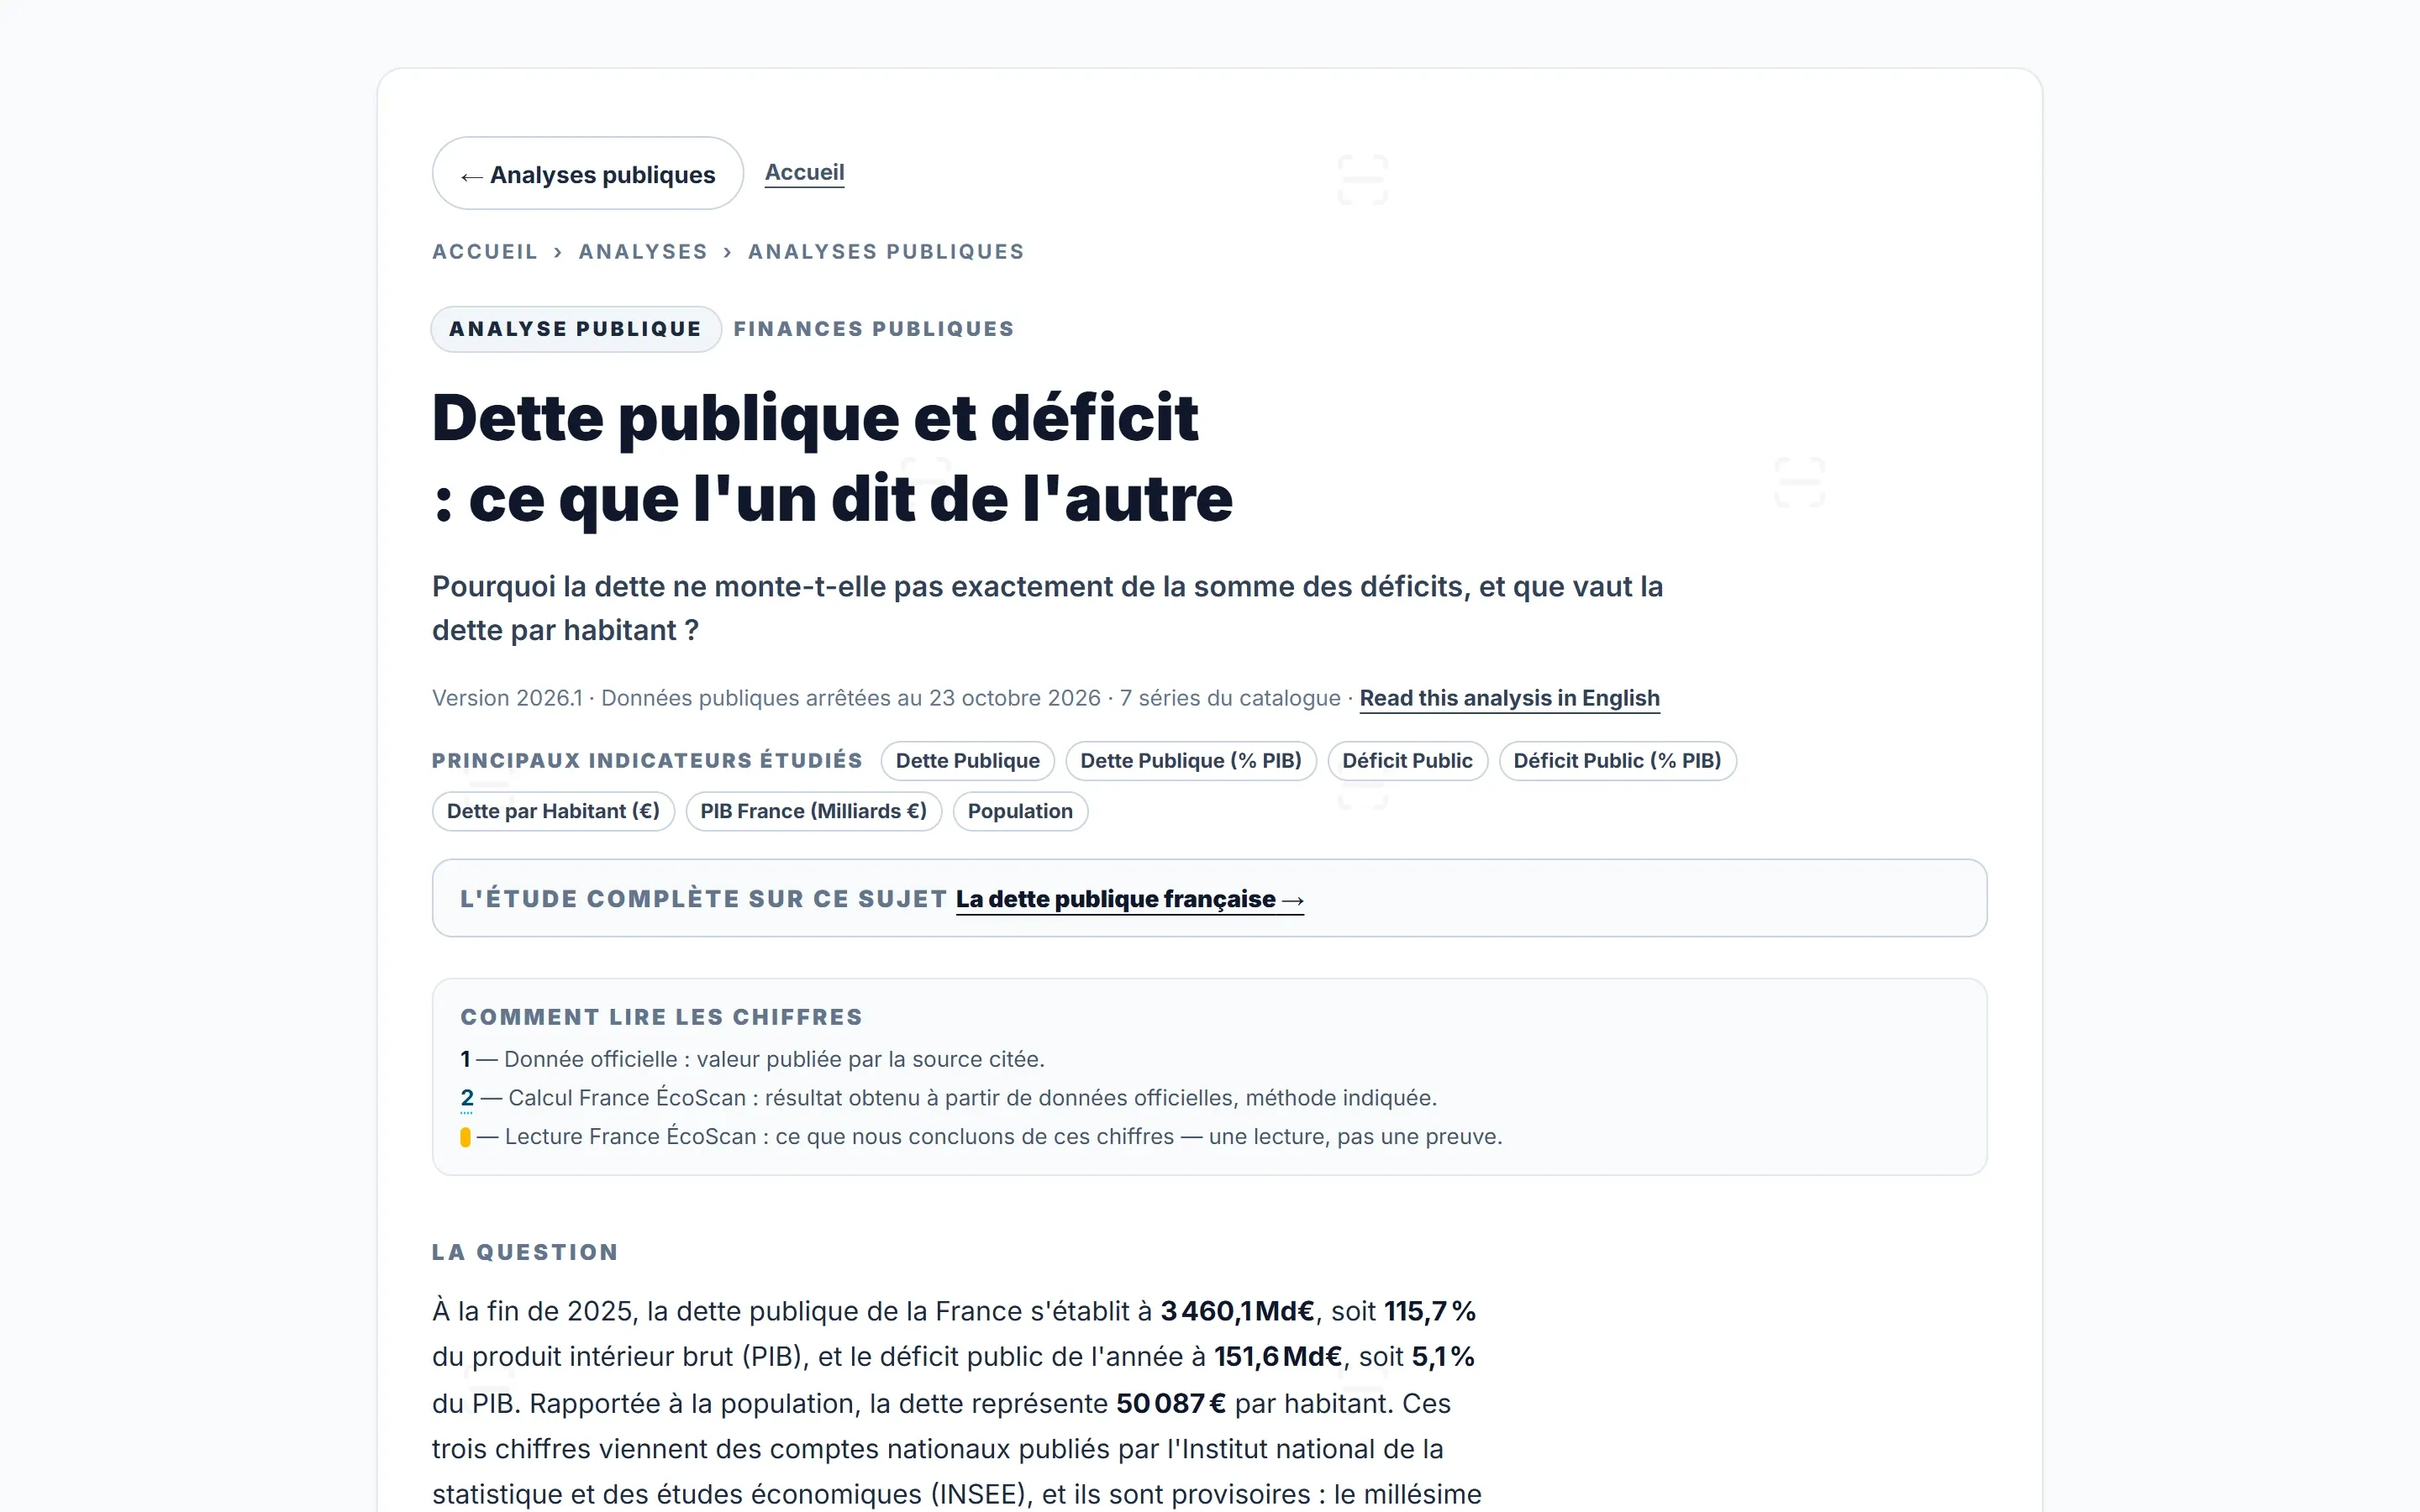
Analysis catalogue in the France ÉcoScan Observatory (French interface): major studies published as numbered issues (public debt, minimum wage, housing, the cost of wildfires, disposable income), analyses linked to the indicator being viewed, then public analyses free to read.
The analysis catalogue (French interface): major studies on debt, the minimum wage, housing or disposable income, each dated and linked to the indicators it sheds light on.
View full size — Analysis catalogue in the France ÉcoScan Observatory (French interface): major studies published as numbered issues (public debt, minimum wage, housing, the cost of wildfires, disposable income), analyses linked to the indicator being viewed, then public analyses free to read.
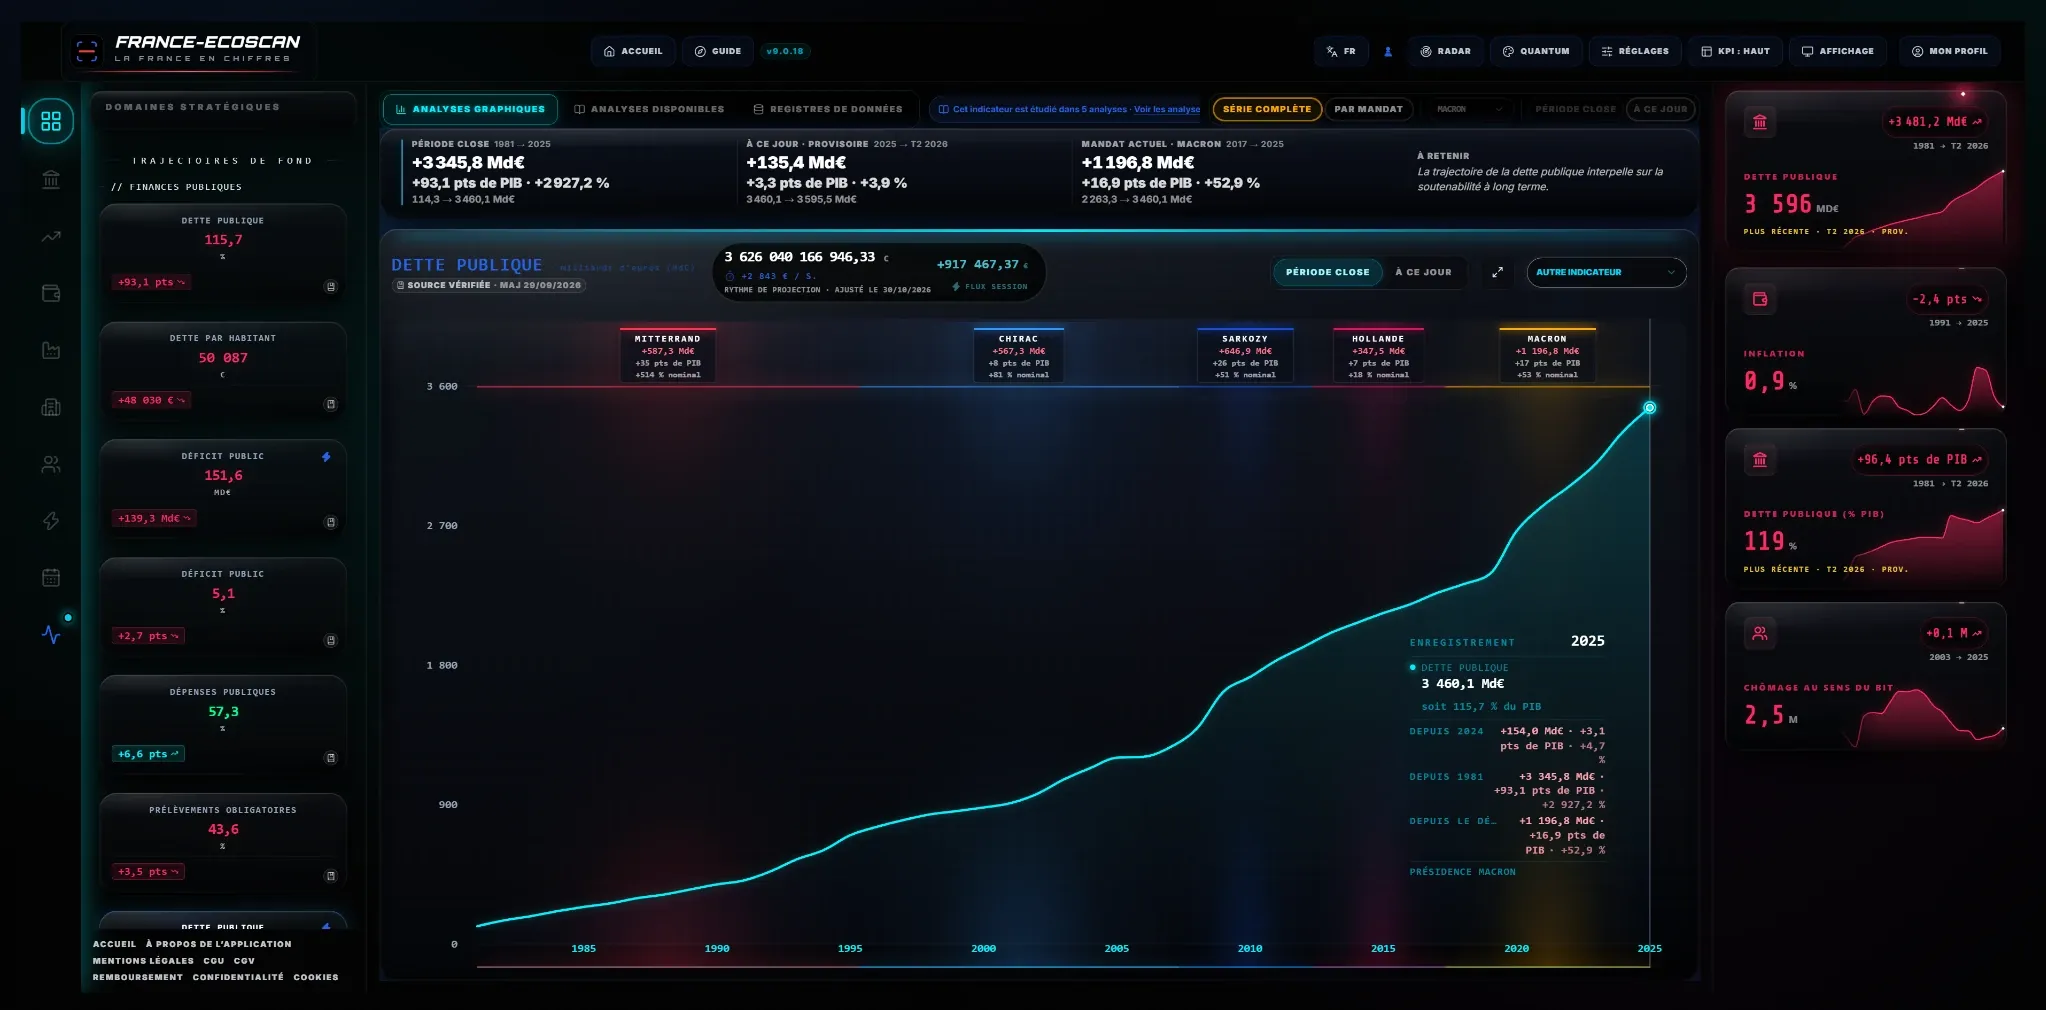
France ÉcoScan Observatory in the dark Quantum theme (French interface): the cyan public debt curve, from 1981 to 2025, runs through the presidential terms from Mitterrand to Macron; 2025 reading: €3,460.1 billion, i.e. 115.7% of GDP; on the left, the public finance indicators; on the right, four key indicators: public debt, inflation, debt as a share of GDP, unemployment.
The Observatory in “Quantum”, the product’s dark theme (French interface): public debt from 1981 to 2025, read term by term with INSEE series — available with a free account.
View full size — France ÉcoScan Observatory in the dark Quantum theme (French interface): the cyan public debt curve, from 1981 to 2025, runs through the presidential terms from Mitterrand to Macron; 2025 reading: €3,460.1 billion, i.e. 115.7% of GDP; on the left, the public finance indicators; on the right, four key indicators: public debt, inflation, debt as a share of GDP, unemployment.

Starting point

Debt, unemployment, inflation, growth: the figures circulate without their context — without their source, their period, or the series that gives them meaning.

Design stance

Never separate a figure from its source. Every value is tied to its public producer and placed in its long-run trajectory, so that today’s number reads within its series; every statement says what it is — official data, calculation, interpretation or unproven lead.

What was built

  • A catalogue of 61 indicators, each tied to a named public producer: INSEE, Eurostat, the European Central Bank.
  • Public indicator pages and analyses, in French and English.
  • An Observatory with a free account: full series since 1981, cross-analyses, counters, and a reading by presidential term.
  • Public analyses across ten broad themes — public finances, employment, housing, energy, industry, savings…
  • Major studies published as numbered issues, with a public preview, readable online and as PDF.
  • Sources and Methodology pages, and a public log of revisions.

A few published topics

  • Public finances Public debt and deficit: what one says about the other
  • Purchasing power Does the French minimum wage keep up with inflation?
  • Employment Does France need growth to bring unemployment down?
  • Industry Is France still deindustrialising?
  • Housing Why France stopped building: rates, costs or land?
  • Energy Electricity prices in France: households, industry, the European market

Requirements held

Traceable
Every value carries its source, period, unit, scope and status.
Clear about its nature
Every statement says what it is: official data, calculation, interpretation or unproven lead.
Checked against the producer
No value is typed in by hand: each update is checked against the producer’s own publication.
Explanatory
A figure comes with its definition, its trend and the reason it matters.

Verifiable evidence

indicators, each tied to a named public producer
61

Limit. The number changes as the catalogue evolves.

Source — 61 indicators, each tied to a named public producer

Product indicator catalogue, checked on 31 October 2026; public indicator pages on france-ecoscan.fr.

analyses in French and English: 13 free to read in full, 9 with a public preview
22

Limit. The rest of the 9 in-depth analyses can be read with a free account.

Source — 22 analyses in French and English: 13 free to read in full, 9 with a public preview

Product analysis catalogue and analysis pages on france-ecoscan.fr, checked on 31 October 2026.

start of the long-run series
1981
Source — 1981 start of the long-run series

France ÉcoScan public export of annual indicators (public debt series, produced by INSEE).

Good to know

  • An independent service, separate from government: data and analysis, not advice or a guaranteed forecast.
  • Presidential terms situate a period; on their own, they do not explain a change.
  • Live counters are projections, and labelled as such.

Status

Live. Public indicator pages and analyses; the Observatory with a free account.

france-ecoscan.fr (external site)

What this work demonstratesfor your project.

  • Bringing together data from several sources while keeping, for every value, its origin, period and status.
  • Checking each update automatically against its source instead of re-keying it.
  • Making numerical material readable for non-specialists without losing rigour.

Is your project in a completely different field? That is exactly what this work shows: the ability to understand a new trade and build the tool that fits it.

Discuss my project